Calling Functions via Accessors
A subset of esmtools functions are registered as xarray accessors. What this means is that you can call some of these functions as you would .isel(), .coarsen(), .interp(), and so on with xarray.
There is just one extra step to do so. After importing esmtools, you have to do add the module call after ds and then the function. For example, you can call ds.grid.convert_lon() to transform between -180 to 180 longitudes and 0 to 360 longitudes.
List of currently supported modules/functions. See the API for usage.
grid- convert_lon()
[1]:
import esmtools
import numpy as np
import xarray as xr
[2]:
lat = np.linspace(-89.5, 89.5, 180)
lon = np.linspace(0.5, 359.5, 360)
empty = xr.DataArray(np.empty((180, 360)), dims=['lat', 'lon'])
data = xr.DataArray(np.linspace(0, 360, 360), dims=['lon'],)
data, _ = xr.broadcast(data, empty)
data = data.T
data['lon'] = lon
data['lat'] = lat
[3]:
print(data)
<xarray.DataArray (lat: 180, lon: 360)>
array([[  0.        ,   1.00278552,   2.00557103, ..., 357.99442897,
        358.99721448, 360.        ],
       [  0.        ,   1.00278552,   2.00557103, ..., 357.99442897,
        358.99721448, 360.        ],
       [  0.        ,   1.00278552,   2.00557103, ..., 357.99442897,
        358.99721448, 360.        ],
       ...,
       [  0.        ,   1.00278552,   2.00557103, ..., 357.99442897,
        358.99721448, 360.        ],
       [  0.        ,   1.00278552,   2.00557103, ..., 357.99442897,
        358.99721448, 360.        ],
       [  0.        ,   1.00278552,   2.00557103, ..., 357.99442897,
        358.99721448, 360.        ]])
Coordinates:
  * lon      (lon) float64 0.5 1.5 2.5 3.5 4.5 ... 355.5 356.5 357.5 358.5 359.5
  * lat      (lat) float64 -89.5 -88.5 -87.5 -86.5 -85.5 ... 86.5 87.5 88.5 89.5
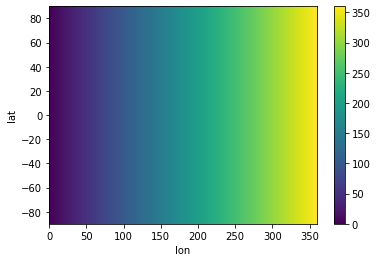
Our sample data is just a plot of longitude.
[4]:
data.plot(x='lon', y='lat')
[4]:
<matplotlib.collections.QuadMesh at 0x7fb3ec38a668>
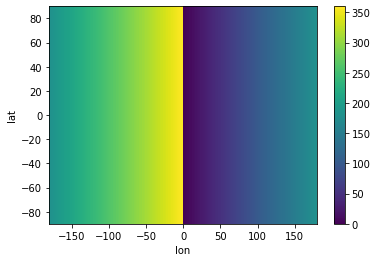
However, it ranges from 0 to 360, which is sometimes problematic. We can use the accessor convert_lon() to convert this to -180 to 180.
[5]:
help(data.grid.convert_lon)
Help on method convert_lon in module esmtools.accessor:

convert_lon(coord='lon') method of esmtools.accessor.GridAccessor instance
    Converts longitude grid from -180to180 to 0to360 and vice versa.

    .. note::
        Longitudes are not sorted after conversion (i.e., spanning -180 to 180 or
        0 to 360 from index 0, ..., N) if it is 2D.

    Args:
        ds (xarray object): Dataset to be converted.
        coord (optional str): Name of longitude coordinate, defaults to 'lon'.

    Returns:
        xarray object: Dataset with converted longitude grid.

    Raises:
        CoordinateError: If ``coord`` does not exist in the dataset.
[6]:
converted = data.grid.convert_lon(coord='lon')
Now we’ve switched over to the -180 to 180 coordinate system.
[7]:
converted
[7]:
- lat: 180
- lon: 360
- 180.5 181.5 182.5 183.5 184.5 185.5 ... 175.5 176.5 177.5 178.5 179.5
array([[180.50139276, 181.50417827, 182.50696379, ..., 177.49303621, 178.49582173, 179.49860724], [180.50139276, 181.50417827, 182.50696379, ..., 177.49303621, 178.49582173, 179.49860724], [180.50139276, 181.50417827, 182.50696379, ..., 177.49303621, 178.49582173, 179.49860724], ..., [180.50139276, 181.50417827, 182.50696379, ..., 177.49303621, 178.49582173, 179.49860724], [180.50139276, 181.50417827, 182.50696379, ..., 177.49303621, 178.49582173, 179.49860724], [180.50139276, 181.50417827, 182.50696379, ..., 177.49303621, 178.49582173, 179.49860724]]) - lon(lon)float64-179.5 -178.5 ... 178.5 179.5
array([-179.5, -178.5, -177.5, ..., 177.5, 178.5, 179.5])
- lat(lat)float64-89.5 -88.5 -87.5 ... 88.5 89.5
array([-89.5, -88.5, -87.5, -86.5, -85.5, -84.5, -83.5, -82.5, -81.5, -80.5,
       -79.5, -78.5, -77.5, -76.5, -75.5, -74.5, -73.5, -72.5, -71.5, -70.5,
       -69.5, -68.5, -67.5, -66.5, -65.5, -64.5, -63.5, -62.5, -61.5, -60.5,
       -59.5, -58.5, -57.5, -56.5, -55.5, -54.5, -53.5, -52.5, -51.5, -50.5,
       -49.5, -48.5, -47.5, -46.5, -45.5, -44.5, -43.5, -42.5, -41.5, -40.5,
       -39.5, -38.5, -37.5, -36.5, -35.5, -34.5, -33.5, -32.5, -31.5, -30.5,
       -29.5, -28.5, -27.5, -26.5, -25.5, -24.5, -23.5, -22.5, -21.5, -20.5,
       -19.5, -18.5, -17.5, -16.5, -15.5, -14.5, -13.5, -12.5, -11.5, -10.5,
        -9.5,  -8.5,  -7.5,  -6.5,  -5.5,  -4.5,  -3.5,  -2.5,  -1.5,  -0.5,
         0.5,   1.5,   2.5,   3.5,   4.5,   5.5,   6.5,   7.5,   8.5,   9.5,
        10.5,  11.5,  12.5,  13.5,  14.5,  15.5,  16.5,  17.5,  18.5,  19.5,
        20.5,  21.5,  22.5,  23.5,  24.5,  25.5,  26.5,  27.5,  28.5,  29.5,
        30.5,  31.5,  32.5,  33.5,  34.5,  35.5,  36.5,  37.5,  38.5,  39.5,
        40.5,  41.5,  42.5,  43.5,  44.5,  45.5,  46.5,  47.5,  48.5,  49.5,
        50.5,  51.5,  52.5,  53.5,  54.5,  55.5,  56.5,  57.5,  58.5,  59.5,
        60.5,  61.5,  62.5,  63.5,  64.5,  65.5,  66.5,  67.5,  68.5,  69.5,
        70.5,  71.5,  72.5,  73.5,  74.5,  75.5,  76.5,  77.5,  78.5,  79.5,
        80.5,  81.5,  82.5,  83.5,  84.5,  85.5,  86.5,  87.5,  88.5,  89.5])
[8]:
converted.plot(x='lon', y='lat')
[8]:
<matplotlib.collections.QuadMesh at 0x7fb3ec296668>

This is equivalent to running the functional convert_lon() argument:
[9]:
converted = esmtools.grid.convert_lon(data, coord='lon')
[10]:
converted.plot(x='lon', y='lat')
[10]:
<matplotlib.collections.QuadMesh at 0x7fb3ec07b080>