[1]:
import xarray as xr
import PMMPIESM as PM
import glob
import numpy as np
[2]:
path = '/work/mh0727/m300524/experiments/results/'
[40]:
tos = xr.open_dataarray(path+'control_tsw_mm.nc')
[37]:
light = xr.open_dataarray(path+'control_soflwac_mm.nc')
/work/mh0727/m300524/anaconda3/envs/my_jupyter/lib/python3.6/site-packages/xarray/coding/times.py:122: SerializationWarning: Unable to decode time axis into full numpy.datetime64 objects, continuing using dummy cftime.datetime objects instead, reason: dates out of range
  result = decode_cf_datetime(example_value, units, calendar)
/work/mh0727/m300524/anaconda3/envs/my_jupyter/lib/python3.6/site-packages/xarray/coding/variables.py:69: SerializationWarning: Unable to decode time axis into full numpy.datetime64 objects, continuing using dummy cftime.datetime objects instead, reason: dates out of range
  return self.func(self.array)
[8]:
fe = xr.open_dataarray(path+'control_dfeos_mm.nc')
[5]:
po4 = xr.open_dataarray(path+'control_po4os_mm.nc')
[10]:
no3 = xr.open_dataarray(path+'control_no3os_mm.nc')
[41]:
ds_nut = xr.merge([fe,po4,no3])
ds_tp = xr.merge([tos,light])
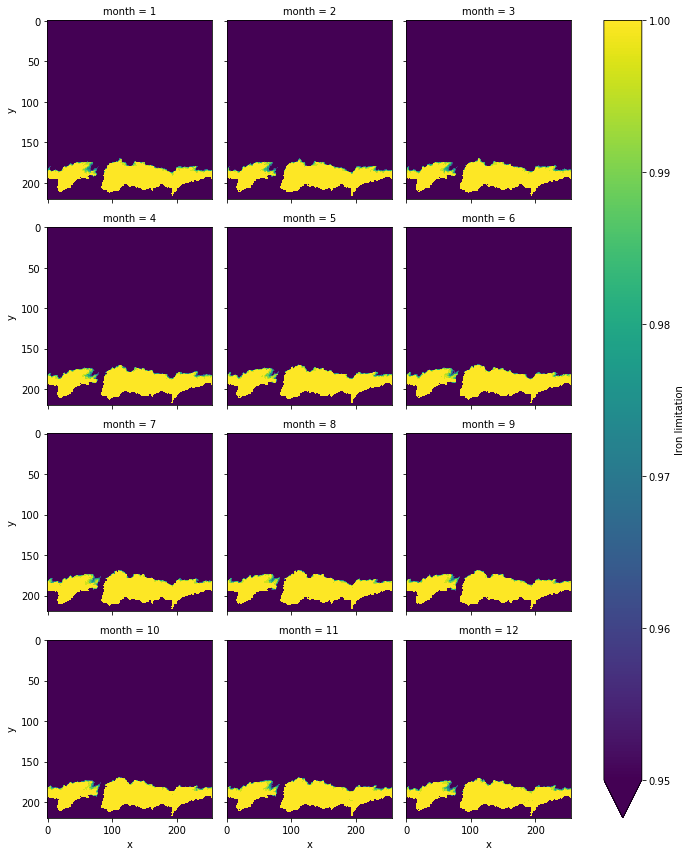
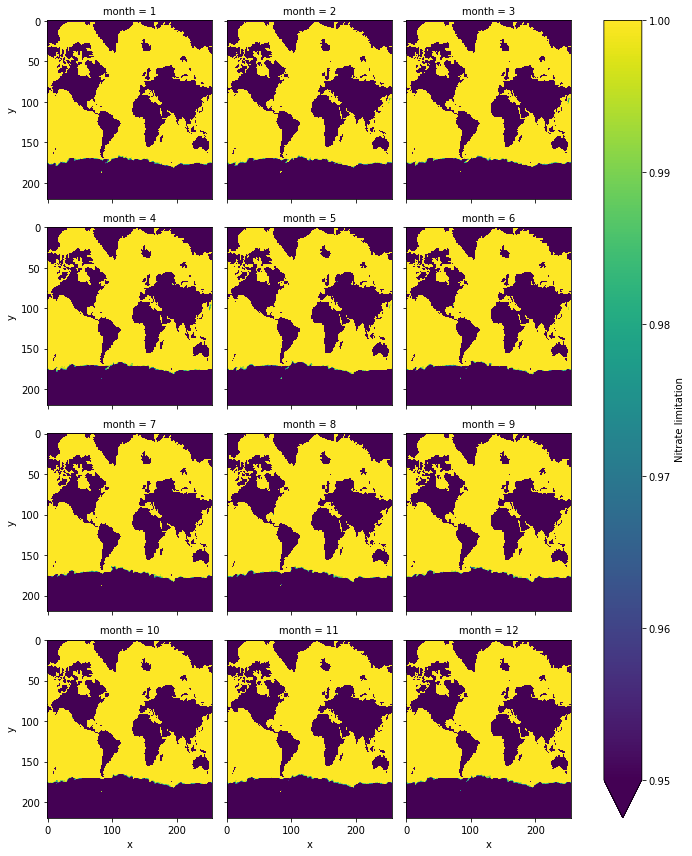
Nutrient availability
Context: value of 1 means limited by nutrient. The less the more primary productivity.
[44]:
nutlim, iron_lim, nitrate_lim, phos_lim = PM.hamocc.get_nutlimf(ds_nut)
[45]:
nutlim_seasonality = nutlim.groupby('time.month').mean('time')
/work/mh0727/m300524/anaconda3/envs/my_jupyter/lib/python3.6/site-packages/xarray/core/nanops.py:161: RuntimeWarning: Mean of empty slice
  return np.nanmean(a, axis=axis, dtype=dtype)
[46]:
nutlim_seasonality.plot(col='month',col_wrap=3, yincrease=False)
[46]:
<xarray.plot.facetgrid.FacetGrid at 0x2b188e025a58>

[63]:
iron_lim_seasonality = iron_lim.groupby('time.month').mean('time')
[65]:
iron_lim_seasonality.plot(col='month',col_wrap=3, yincrease=False, vmin=.95)
[65]:
<xarray.plot.facetgrid.FacetGrid at 0x2b19b3886898>
[71]:
nitrate_lim_seasonality = nitrate_lim.groupby('time.month').mean('time')
[73]:
nitrate_lim_seasonality.plot(col='month',col_wrap=3, yincrease=False, vmin=.95)
[73]:
<xarray.plot.facetgrid.FacetGrid at 0x2b19b4c31b70>
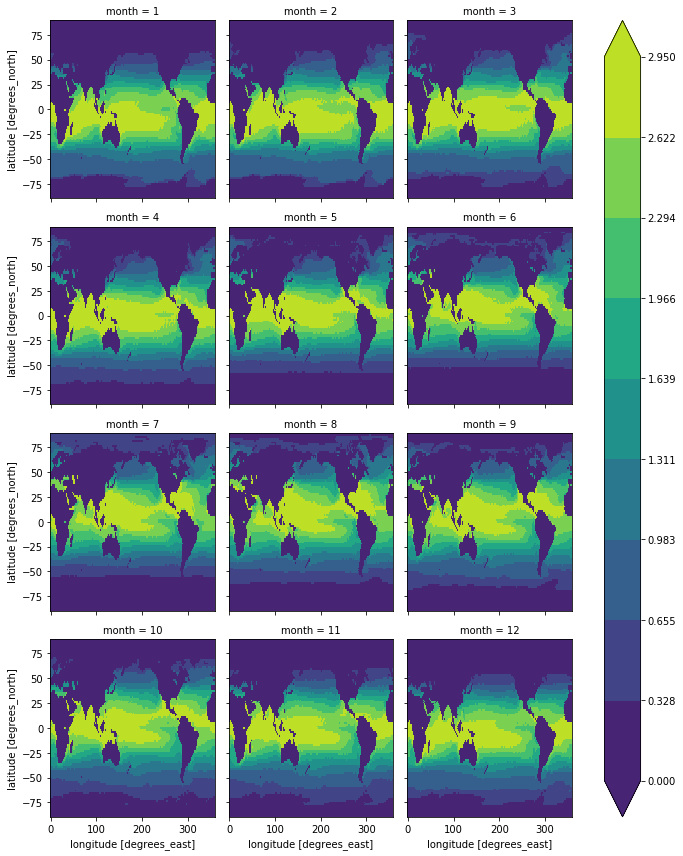
Temp light dependence
Temperature-light dependent primary productivity growth factor. The larger the more PP.
[47]:
ds.data_vars
[47]:
Data variables:
    tos      (time, y, x) float32 nan nan nan nan nan ... nan nan nan nan nan
    soflwac  (time, lat, lon) float32 nan nan nan nan nan ... 0.0 0.0 0.0 0.0
    dfeos    (time, y, x) float32 nan nan nan nan nan ... nan nan nan nan nan
    po4os    (time, y, x) float32 nan nan nan nan nan ... nan nan nan nan nan
    no3os    (time, y, x) float32 nan nan nan nan nan ... nan nan nan nan nan
[49]:
def temfa_phofa(ds):
    temfa = .6 * 1.066 ** (ds['tsw'] - 273.15)
    phofa = ds['soflwac'] * 0.02
    return temfa * phofa / (np.sqrt( phofa ** 2 + temfa ** 2 ))
[50]:
tp = temfa_phofa(ds_tp)
[51]:
tp_seasonality = tp.groupby('time.month').mean('time')
[62]:
tp_seasonality.plot(col='month',col_wrap=3, cmap='viridis', robust=True, levels=10, vmin=0)
[62]:
<xarray.plot.facetgrid.FacetGrid at 0x2b19b2cc6f60>
[ ]:
cyanos
[ ]: